What will you learn through this module?
- Financial statements are written records that convey the business activities and the financial performance of an entity.
- The balance sheet provides an overview of assets, liabilities, and shareholders' equity as a snapshot in time.
- The income statement primarily focuses on a companys revenues and expenses during a particular period. Once expenses are subtracted from revenues, the statement produces a company's profit figure called net income.
- The cash flow statement (CFS) measures how well a company generates cash to pay its debt obligations, fund its operating expenses, and fund investments.
Introduction
Financial statements are written documents/records that indicate how a company has accomplished financially in a fiscal year and provide information about the business activities and the financial performance. At the same time, investors and financial analysts depend upon financial records to analyze a company's performance and estimate the future trend of the company's share price.
These statements are prepared based on different time frames, such as quarterly, half-yearly, and annual. However, firms can equip only one statement to show their financial inflow and outflows. Still, it is difficult for various stakeholders to rely solely upon one piece of information for their decision-making regarding the share price. Thus, firms need to prepare more than one financial statement to ensure that all stakeholders can clearly understand their financial status and performance.
Meaning & types of financial statements
Types of Financial Statements:
Now let's look at the various types of financial statements:
- Balance Sheet: The balance sheet is a financial statement that explains the assets, liabilities, and shareholders' equity. Many companies use the shareholders' equity as a separate financial statement as a Statement of Changes in Shareholder's Equity, but generally, it comes with the balance sheet. The integral equation that you need to remember when you prepare a balance sheet is this:
Assets = Liabilities + Shareholder’s Equity
- Income Statement: An income statement is a type of financial statement that summarizes the revenues and expenses of a company. This statement measures a company's financial performance in terms of profits or losses for the accounting period. All business stakeholders use income statements to understand and compare financial performance. It calculates net profit after tax by tallying revenues, expenses, gains, and losses. An income statement helps discover areas where expenses can be controlled and generate more income. Thus, this data is essential for planning.
- Cash Flow Statement: Every investor should consider the Cash Flow Statement the third primary statement. It measures how well a company makes cash to repay its debt commitments, provide finances to cover its operating expenses and fund investments. This statement complements the balance sheet and income statement. It comprises three sections that report cash flow for the activities a company uses its cash: operating, investing, and financing.
- Statement of Changes in Shareholder's Equity: The statement of changes in equity calculates total equity over some time. This data links to the balance sheet for the same period; the ending balance on the change of equity statement is the same as the total equity stated on the balance sheet.
Analysis and Interpretation of Financial Statements
Financial statements are of great importance; no matter which form of financial statement it is, each of them helps to measure a company's financial status and performance based on the components they separately take into account. This help to show how a business operates and provides insight into how much and how a company generates revenues, what the cost of doing business is, how efficiently it manages its cash, and what its assets and liabilities are. Financial statements provide all the detail on how well or poorly a company organizes itself.
Whether these statements are independently taken or as a combined credential, they are used as the primary basis of information for stakeholders, mainly investors, helping them make sensible and well-informed decisions. The financial statements analysis helps both the management and investors. Investors use these statements to understand how companies are growing and choose whether to invest in the financial instruments offered in the market. On the other hand, the management uses financial statements to make strategic decisions, keeping in mind the growth of the business and its expansion.
If a company's financial statements portray performance enhancement, it indicates growth. As a result, investors know that investing in the entity would be a good idea. On the other hand, if the expenses, debt, and costs recorded in the statements are more than the revenue, income, and profits, the company's performance is doubtful. This, in turn, refrains investors from investing in those entities.
Financial Analysis and Its Types
Financial analysis is a process that helps to assess businesses, projects, budgets, and other finance-related transactions to conclude their performance and suitability. Usually, financial analysis is used to analyze whether a company is stable, solvent, liquid, or profitable enough to fund an investment. This process is completed with the help of financial numbers and data. A financial analyst will carefully inspect a company's financial statements - the income statement, balance sheet, cash flow statement, and Statement of Changes in Shareholder's Equity. Ratio analysis is one of the most popular ways to analyze financial data, which helps to compare with other companies or against the company's historical performance.
Types of financial analysis:
There are two types of financial analysis: fundamental analysis and technical analysis-
- Fundamental Analysis: Fundamental analysis uses ratios collected from data within the financial statements, such as a company's earnings per share (EPS), to determine the business's value. Using ratio analysis and a thorough review of economic and financial situations surrounding the company, an investor/analyser can reach an intrinsic value for the security. The main objective is to get a number that an investor can compare with a security's current price to see whether the security is undervalued or overvalued.
- Technical Analysis: Technical analysis uses statistical trends from trading activity, such as moving averages (MA). Technical analysis assumes that a security's price reflects all publicly available information and instead focuses on the statistical analysis of price movements. Technical analysis attempts to understand the market sentiment behind price trends by looking for patterns and trends rather than analyzing a security's fundamental attributes.
Balance Sheet and framework
A balance sheet presents a company's financial position at a specific time. It shows a company's assets, liabilities, and equity. The balance sheet is an essential financial statement that helps stakeholders, such as investors, creditors, and analysts, assess the company's financial health, liquidity, and solvency.
The balance sheet follows a basic framework comprising three primary components: assets, liabilities, and equity. Assets represent the economic resources that a company owns or controls and are expected to provide future economic benefits. Liabilities represent the obligations a company owes to creditors and other parties and are expected to require future financial sacrifices. Equity depicts the residual claim in a company's assets after subtracting liabilities.

Assets are further divided into two categories: current assets and non-current assets. Current assets are those assets that are anticipated to be transformed into cash within a one-year time frame or one operating cycle, whichever is lengthier. Existing assets comprise cash, accounts receivable, inventory, and prepaid expenses. Non-current assets are not anticipated to be transformed into cash within one year or one operating cycle. Non-current assets contain property, plant, equipment, intangible assets, and investments.
- Liabilities are also classified into two categories: current liabilities and non-current liabilities. Current liabilities are those anticipated to be paid in a one-year or one operating cycle, whichever is longer. Examples of current liabilities include accounts payable, accrued expenses, and short-term borrowings. Non-current liabilities are not expected to be settled within one year or one operating cycle. Non-current liabilities contain long-term debt, pension obligations, and lease liabilities.
- Equity depicts the residual claim in a company's assets after subtracting liabilities. Equity can be further classified into two parts: contributed capital and retained earnings. Contributed capital denotes the capital that a company raises from issuing shares to investors. Retained earnings represent the accumulated profits of a company that have not been distributed to shareholders as dividends.
The balance sheet is structured to ensure that the total assets always equal the total liabilities and equity. This is known as the accounting equation, which states that Assets = Liabilities + Equity. This fundamental equation forms the basis for the balance sheet and reflects the basic principle of double-entry accounting.
In conclusion, the balance sheet is a critical financial statement that provides information about a company's financial position, liquidity, and solvency. The framework of the balance sheet consists of three primary components: assets, liabilities, and equity. The balance sheet is structured to ensure that the total assets always equal the total liabilities and equity, reflecting the fundamental principle of double-entry accounting. Understanding the balance sheet is essential for investors, creditors, and other stakeholders to make informed decisions about a company's financial health and performance.
Income Statement and Framework
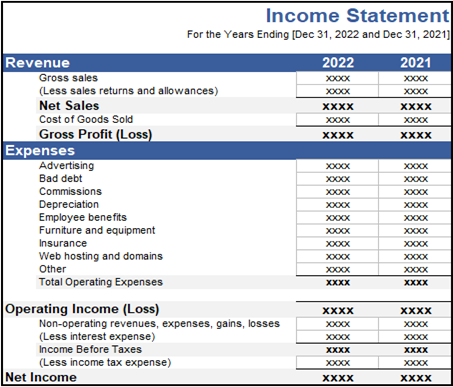
An income statement, also known as a profit and loss statement, is a financial statement that summarizes a company's revenues, expenses, gains, and losses over a specified period, typically a quarter or a year. The purpose of the income statement is to provide stakeholders with an overview of the company's financial performance, precisely how much money the company has made or lost during the specified period. The framework of an income statement consists of three primary sections: revenues, expenses, and net income. Let us take a closer look at each section:
- Revenues: This section represents the money a company earns from its operations during a particular period. Revenues comprise sales of goods or services, rental income, interest income, and other income streams. It is essential to note that revenues only contain money earned during the specified period, regardless of when the payment was received.
- Expenses: This section depicts the costs associated with the company's operations during a particular period. Expenses incorporate the cost of goods sold, salaries and wages, rent, utilities, advertising, and other costs associated with running a business. It is necessary to note that expenses only include costs incurred during the specified period, regardless of when the payment was made.
- Net Income: Net income represents the company's profit or loss for the specified period. The total expenses are subtracted from the total revenue to calculate net income. If the result is positive, the company has made a profit. If the impact is negative, the company has incurred a loss.
In addition to providing stakeholders with an overview of the company's financial performance, an income statement is also a helpful tool for management. By analyzing the income statement, management can determine where the company is functioning well and where improvements can be made. For example, if the cost of goods sold is consistently high, management may look for ways to lower these costs to enhance profitability.
Cash Flow Statement and Framework
A Cash Flow statement is a financial statement that gives information on the inflow and outflow of cash in a company. It is a critical financial statement that shows the movement of cash and cash equivalents during a specific period. A cash flow statement helps to evaluate an organization's financial performance, liquidity, and ability to meet its financial obligations.
The framework of a Cash Flow statement includes three major sections: Operating activities, investing activities, and Financing activities.
- Operating activities: This section of the Cash Flow statement records cash inflows and outflows generated from an organization's primary activities. The operating activities include cash received from customers for goods or services sold, cash paid to suppliers for raw materials or inventory, payment of salaries to employees, payment of taxes, payment of interest on loans or debentures, and payment of dividends to shareholders. The operating activities depict an organization's cash flow from its core business operations.
- Investing activities: This section of the Cash Flow statement records cash inflows and outflows from investing activities. Investing activities include purchasing or selling long-term assets such as property, plant, and equipment, buying or selling investments, and lending or borrowing funds. Investing activities reflect the cash flow generated and show how an organization uses its resources to create future income.
- Financing activities: This section of the Cash Flow statement records cash inflows and outflows from financing activities. The financing activities include issuing or repurchasing or repaying long-term debt, issuing or repurchasing shares, paying dividends, and receiving or paying any other long-term liabilities. Financing activities show how an organization raises capital and repays its debt.

The net increase or decrease in cash and cash equivalents is calculated by adding the cash flows from operating, investing, and financing activities. The net cash flow from the three sections is then added to the beginning balance of cash and cash equivalents to reach the ending balance of cash and cash equivalents.
In conclusion, the Cash Flow statement is an essential financial statement that shows a company's cash inflows and outflows. It helps in analysing the liquidity and financial performance of an organization. The framework of the Cash Flow statement consists of three sections: Operating activities, investing activities, and Financing activities. The format of the Cash Flow statement includes the cash inflows and outflows from each section, and the net increase or decrease in cash and cash equivalents is calculated to arrive at the ending balance of cash and cash equivalents.
Techniques of Financial Analysis
The financial analysis evaluates a company's financial health, performance, and viability by examining its financial statements, such as the income statement, balance sheet, and cash flow statement. Investors, creditors, and other stakeholders use several financial analysis techniques to assess a company's financial position and make knowledgeable investment decisions. This section will discuss some of the most used financial analysis techniques.
- Ratio Analysis: Ratio analysis is a widely used technique of financial analysis that involves comparing two or more financial ratios to gain insights into a company's financial health and performance. Ratio analysis can assess a company's liquidity, solvency, profitability, and efficiency. Some commonly used ratios comprise the current, quick, debt-to-equity, return on equity (ROE), and return on assets (ROA).
- Trend Analysis: Trend analysis is a technique that implicates analyzing financial data over multiple periods to determine trends and patterns in a company's financial performance. By investigating historical data, analysts can identify areas where the company's financial performance has improved or worsened over time and make predictions about future performance.
- Vertical Analysis: Vertical analysis involves analyzing a company's financial statements by representing each item as a percentage of a base item, usually total assets or revenues. This technique can identify trends and patterns in a company's financial statements and compare the relative size of different items.
- Horizontal Analysis: Horizontal analysis involves comparing a company's financial statements over multiple periods to identify changes in financial performance over time. This technique can identify trends, patterns, and anomalies in a company's financial statements.
- DuPont Analysis: DuPont analysis is a technique that breaks down the components of ROE to gain insights into a company's profitability, efficiency, and leverage. The DuPont model is based on ROE = net income / total equity, broken into three components: net profit margin, asset turnover, and financial leverage.
- Cash Flow Analysis: Cash flow analysis involves analyzing a company's cash flow statement to gain insights into its liquidity and cash management. Analysts can assess a company's ability to generate cash, pay its debts, and invest in future growth by examining the sources and uses of cash over a specified period.
- Valuation Analysis: Valuation analysis involves estimating the intrinsic value of a company's stock by using a variety of techniques, such as discounted cash flow analysis, price-to-earnings ratio (P/E ratio), price-to-sales ratio (P/S ratio), and price-to-book ratio (P/B ratio). This technique can determine whether a company's stock is undervalued or overvalued relative to its earnings and assets.
Limitations of Financial Analysis
The financial analysis evaluates an organization's financial performance, position, and prospects by analysing its financial statements. It is a vital tool for investors, creditors, and other stakeholders to make informed decisions regarding an organization's financial health. However, financial analysis has limitations that can affect its accuracy and usefulness. In this section, we will discuss some of the limitations of financial analysis:
- Historical data: Financial analysis is based on historical financial data. Past performance does not guarantee future performance. Economic conditions, industry trends, and other external factors can impact an organization's financial performance. Therefore, financial analysis should be used with other forecasting techniques to predict future performance accurately.
- Limitations of accounting standards: Financial analysis relies on the accounting standards used to prepare financial statements. Accounting standards may vary between countries, and differences in accounting practices can affect the comparability of financial statements. Therefore, financial analysis should be conducted with an understanding of the accounting standards used to prepare the financial statements.
- Comparability of financial statements: Financial analysis involves comparing the financial performance of an organization over time or with other organizations. However, differences in accounting methods and assumptions can affect the comparability of financial statements. Therefore, adjusting financial statements to make them comparable before conducting an economic analysis is essential.
- Non-financial factors: Financial analysis does not consider non-financial factors such as the quality of management, employee morale, and brand reputation. These factors can significantly impact an organization's financial performance and should be considered when making investment decisions.