What will you learn through this module?
- Fibonacci sequence
- Golden Ratio
- Fibonacci Extensions
- Confluence with other indicators
- Caution and Supplementary Analysis
- Interdisciplinary Applications
- Market Psychology
- Flexibility and Adaptability
Introduction
In technical analysis, the Fibonacci Theory is a popular tool traders and analysts use to predict potential price levels, identify support and resistance areas, and determine market trends. It is based on applying Fibonacci ratios and retracement levels to historical price movements.
The key concept in Fibonacci Theory is the use of Fibonacci retracement levels. These levels are derived from the Fibonacci sequence and represent potential price reversal or continuation areas. The most commonly used retracement levels are 38.2%, 50%, and 61.8%, although other levels, such as 23.6% and 78.6%, are also considered.
To apply Fibonacci retracement levels, traders first identify a significant price swing or trend. They then measure the distance between that swing's high and low points and draw horizontal lines at the Fibonacci retracement levels (38.2%, 50%, and 61.8%) along the price axis. These lines act as potential support or resistance levels, indicating where price corrections or reversals may occur.
Traders often look for confluence between Fibonacci retracement levels and other technical indicators, such as trend lines, moving averages, or chart patterns. When multiple indicators align at a specific Fibonacci level, it is a stronger signal for potential market reactions.
Another tool derived from the Fibonacci sequence is the Fibonacci extensions. These levels project potential price targets beyond the initial price swing. They are often used to identify where a trend may extend and help traders set profit targets. Common Fibonacci extension levels include 127.2%, 161.8%, and 261.8%.
The Fibonacci Theory assumes that markets tend to retrace or extend in predictable ratios based on the mathematical properties of the Fibonacci sequence. Traders believe that these levels represent increased buying or selling pressure, leading to potential reversals or continuations in price movements.
However, it's important to note that Fibonacci's Theory needs to be more foolproof, and it should be used in conjunction with other technical analysis tools and indicators. Market conditions and other factors can influence price movements, and relying solely on Fibonacci levels may result in false signals.
In conclusion, the Fibonacci Theory in technical analysis is a method used by traders to identify potential price levels, support and resistance areas, and market trends. By applying Fibonacci retracement levels and extensions, traders aim to anticipate price reversals, continuations, and targets. While it is a widely used tool, it is essential to exercise caution and combine it with other analytical techniques to make well-informed trading decisions.
Fibonacci Retracement and Extensions
Fibonacci retracements and extensions are important tools in technical analysis to identify possible support and resistance levels in financial markets. These tools are based on the Fibonacci sequence, a mathematical sequence where each number is the sum of the two preceding ones (e.g., 0, 1, 1, 2, 3, 5, 8, 13, 21, and so on). This article will explore Fibonacci retracements and extensions, how they are calculated, and their significance in trading and investing.
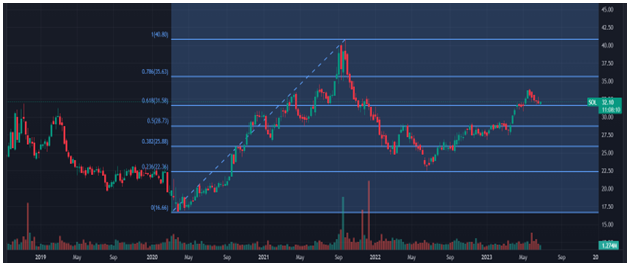
Fibonacci retracements identify potential support or resistance levels during a price correction within a more significant trend. The key Fibonacci retracement levels are 23.6%, 38.2%, 50%, 61.8%, and 78.6%. These levels are derived from ratios found within the Fibonacci sequence. Traders use these levels to determine where the price of a stock is likely to reverse or consolidate before continuing in the direction of the primary trend.
To calculate Fibonacci retracement levels, we must identify two significant points on a price chart: a particular trend's high (swing high) and low (swing low). The retracement levels are then drawn by extending lines from the low to the high point, and horizontal lines are drawn at the earlier Fibonacci ratios.
When the price of an asset retraces to one of these levels, it is believed that there may be increased buying or selling pressure, leading to a potential reversal or consolidation. Traders often use other technical indicators and price patterns in conjunction with Fibonacci retracements to increase the probability of a successful trade.
On the other hand, Fibonacci extensions are used to identify potential price extension levels beyond the initial trend. These levels determine where the price might reach after a significant price movement. The key Fibonacci extension levels are 127.2%, 161.8%, 261.8%, and 423.6%. These levels are also derived from the Fibonacci sequence. To calculate Fibonacci extensions, we need to identify the significant points of a trend: the initial swing low, the subsequent swing high, and any subsequent retracement low. The extension levels are then drawn by extending lines from the swing low to the swing high, and horizontal lines are drawn at the Fibonacci extension ratios.
Traders use Fibonacci extensions to identify potential price targets when an asset is in an uptrend or a downtrend. These levels act as possible areas of resistance or support, where the price may reverse or consolidate once it reaches these levels.
Both Fibonacci retracements and extensions are subjective tools, and different traders may interpret them differently. They are not foolproof indicators but can provide valuable insights into potential price levels where market participants might take action. It is vital to use Fibonacci tools with other technical analysis tools and to consider other factors such as market conditions, fundamental analysis, and risk management.
In conclusion, Fibonacci retracements and extensions are popular tools in the technical analysis used to identify potential support and resistance levels in financial markets. Retracements are used to identify levels where price corrections may end, while extensions are used to determine potential price targets beyond the initial trend. Traders use these tools with other analysis techniques to make informed trading decisions. However, it is essential to remember that these tools are not guaranteed to predict market movements accurately and should be used with other tools and strategies.
Fibonacci retracements and extensions have gained popularity among traders and investors due to their historical significance in market movements. The underlying idea is that these levels act as psychological points of interest for market participants, leading to increased buying or selling activity.
When a Fibonacci retracement level coincides with other technical indicators or chart patterns, it strengthens the significance of that level. For example, if a 61.8% retracement level aligns with a trend line or a moving average, it adds more weight to that level's potential support or resistance.
Traders often use Fibonacci retracements and other tools to confirm potential entry or exit points. For instance, before initiating a trade, they may look for a retracement to a Fibonacci level and wait for a reversal pattern, such as a bullish or bearish candlestick formation.
Additionally, Fibonacci extensions can be used to identify profit targets for existing trades. Traders who believe in continuing trends or extending price momentum may set their profit targets at Fibonacci extension levels. These levels can be areas where traders may consider taking profits or adjusting their positions.
Notably, Fibonacci retracements and extensions are not magical indicators that guarantee successful trades. Like any other technical analysis tool, they have limitations and should be used with other forms of analysis.
Moreover, it's essential to consider the overall market context, news events, and fundamental factors that may influence price movements. Technical analysis alone cannot account for unexpected market developments, and it is crucial to have a comprehensive understanding of the underlying asset and its broader market environment.
In conclusion, Fibonacci retracements and extensions are valuable tools that provide traders and investors with potential levels of support, resistance, and price targets. They are based on the mathematical Fibonacci sequence and have gained recognition due to their historical relevance. However, it is essential to use these tools judiciously, in conjunction with other technical indicators and analysis methods, and to consider fundamental factors to make informed trading decisions.