Market Alert: Ukraine Conflict Update and U.S. Policy Risk
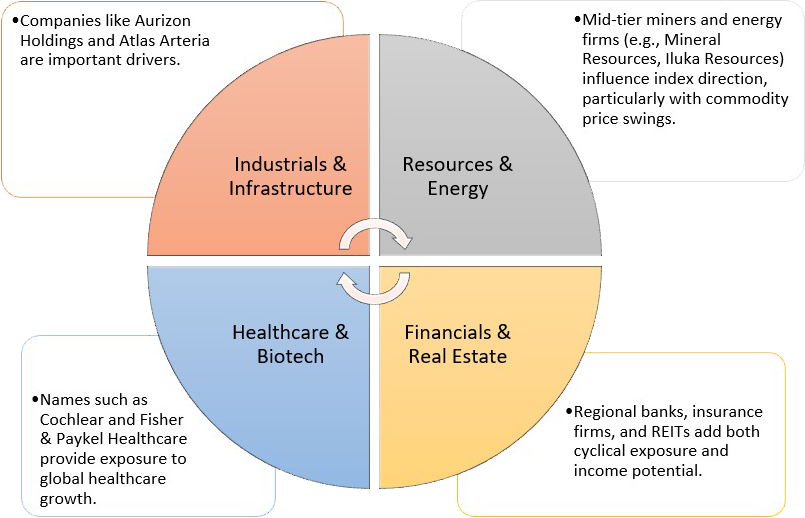
The S&P/ASX Midcap 50 (XMD) index represents the performance of the 51st to 100th largest companies on the ASX by market capitalization, sitting just below the blue-chip ASX 50. It offers a unique blend of established mid-sized firms with strong growth potential and sector diversity across financials, resources, industrials, healthcare, and technology. The XMD is often seen as a “sweet spot” index, balancing stability with growth, as its members tend to be large enough for liquidity but small enough to deliver expansion-driven upside.
Mid-cap stocks are sensitive to shifts in domestic economic conditions, corporate earnings growth, and capital flows. As such, the XMD serves as a useful indicator for investor appetite toward growth and cyclical opportunities within the Australian equity market.
The XMD is less dominated by a handful of giants compared to the ASX 200 or 300, making sectoral contributions more balanced.
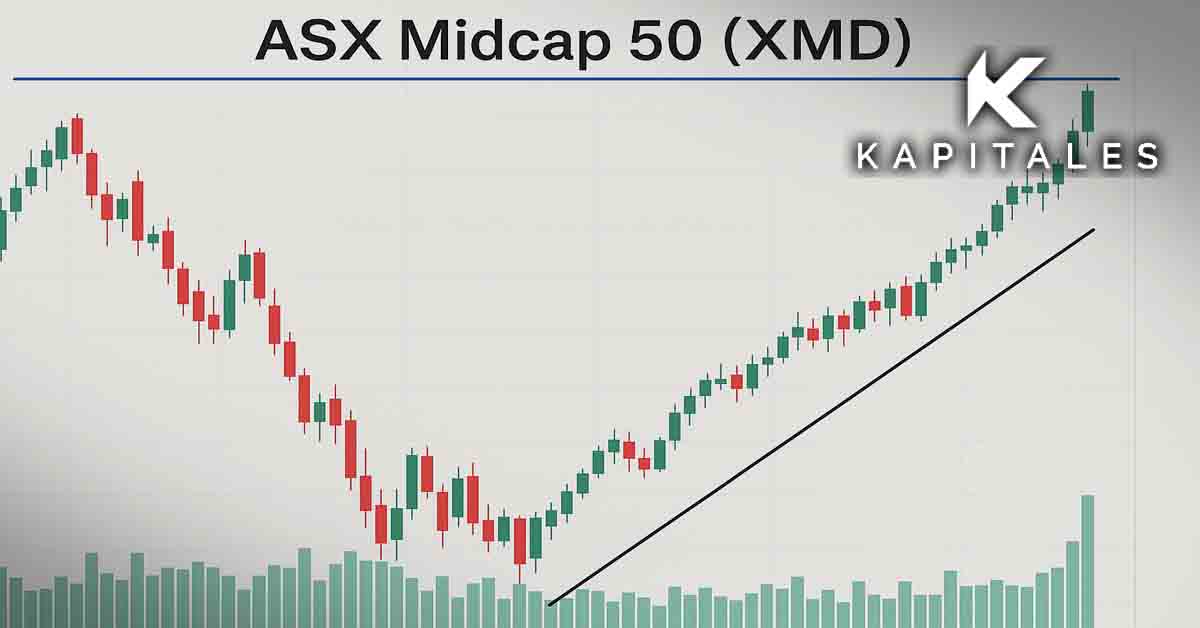
Trend: The index has been in a well-defined uptrend. It is currently testing the upper boundary near AU$11,782.10.
Pivot Levels:
R1: AU$10,967.50 – Cleared strongly, now acting as support.
R2: AU$11,782.10 – Key overhead resistance aligning with channel top.
P: AU$9,877.30 – A medium-term support zone.
The Relative Strength Index (RSI) is approaching overbought territory at around ~68, suggesting strong buying interest but warranting caution for potential short-term pullbacks. Support levels near 3,052.20 (central pivot) and 2,866.50 (pivot support S1) provide downside protection, while immediate resistance lies at 3,463.60 (pivot resistance R2) and 3,689.30 (pivot resistance R3). Overall, the technical setup indicates sustained bullishness, with momentum favoring further gains as long as key support levels hold.
Moving Averages:
The index is trading well above 20 weeks (AU$10,926.30), 50 weeks (AU$10,482.90), 100 weeks (AU$10,065.60) and 200 weeks (AU$9475.60) confirming bullish momentum.
RSI: Currently at ~74, the index is entering overbought territory, suggesting possible consolidation or short-term pullback risk.
Technical View: Momentum remains bullish, but the index is at a critical inflection. A breakout above AU$11,782.10 could trigger further upside, while a rejection could see retracement towards AU$10,967.50.
Australia’s mid-cap segment is set to benefit from easing rate pressures, which could boost demand for industrials, financials, and consumer names, while mid-tier miners remain leveraged to commodities critical for the energy transition. Global exposure through healthcare exporters like Cochlear provides diversification and defensive growth. Key risks include sustained high interest rates, weak consumer trends, and commodity volatility. Overall, the XMD presents a balanced growth and income profile, appealing to investors seeking diversification beyond large-cap names.
The ASX MidCap 50 index is trading near the top of its bullish uptrend, reflecting strong momentum across mid-tier resources, healthcare, and industrial names. While the technical setup points to strength, the overbought RSI suggests the potential for a pause or minor correction before the next leg higher.
Long-term prospects remain constructive, with midcaps well-placed to capture both cyclical recovery and structural growth. A breakout above AU$11,782.10 would confirm a continuation of the rally, whereas consolidation around AU$10,760.30–AU$10,967.50 would provide healthy support for further upside.
Nextgen Global Services Pty Ltd trading as Kapitales Research (ABN 89 652 632 561) is a Corporate Authorised Representative (CAR No. 1293674) of Enva Australia Pty Ltd (AFSL 424494). The information contained in this website is general information only. Any advice is general advice only. No consideration has been given or will be given to the individual investment objectives, financial situation or needs of any particular person. The decision to invest or trade and the method selected is a personal decision and involves an inherent level of risk, and you must undertake your own investigations and obtain your own advice regarding the suitability of this product for your circumstances. Please be aware that all trading activity is subject to both profit & loss and may not be suitable for you. The past performance of this product is not and should not be taken as an indication of future performance.