What will you learn through this module?
- Confirmation of Trends
- Reflecting price momentum
- Support and resistance levels
- Entry and Exit signals
- Delayed response to price changes
Introduction
In technical analysis, lagging indicators are commonly used to assess historical price movements and provide insights into potential future market trends. These indicators are called "lagging" because they trail behind the price action and are based on past data. This article will explore the introduction of lagging indicators in technical analysis and their significance for traders and investors.
Lagging indicators in technical analysis are designed to confirm the direction and strength of price movements after they have occurred. Unlike leading indicators, which aim to predict future price movements, lagging indicators provide a retrospective view of market behaviour. They help identify trends, determine entry and exit points, and validate the sustainability of price movements.
One of the most widely used lagging indicators is the moving average. It calculates the average price of an asset over a specified period and smooths out short-term fluctuations. Moving averages are often employed to identify the overall trend of a market, whether it is bullish (upward), bearish (downward), or ranging (sideways). Traders commonly use crossover strategies, where shorter-term moving averages crossing above or below longer-term moving averages can signal potential buy or sell opportunities.
Another popular lagging indicator is the relative strength index, which measures the speed and change of price movements. RSI oscillates between 0 and 100 and is generally used to identify the overbought and oversold zone in the market. Values above 70 indicate overbought conditions, suggesting a potential reversal or correction, while values below 30 indicate oversold conditions, signalling a possible buying opportunity.
MACD, the moving average convergence divergence, is another widely used lagging indicator that combines moving averages with a histogram. It helps traders identify potential trend reversals, bullish or bearish momentum, and divergence between price and indicator movements. The MACD line represents the difference between two moving averages, while the histogram provides visual cues about the strength of the price trend.
Other lagging indicators include the stochastic oscillator, average true range (ATR), and Bollinger Bands. The stochastic oscillator compares the closing price of a stock to its price range over a specified period, providing insights into overbought and oversold conditions. ATR measures market volatility by calculating the average range between high and low prices. Bollinger Bands consist of a moving average with upper and lower bands based on standard deviations, helping traders assess price volatility and potential breakout levels.
Lagging indicators in technical analysis are widely utilized because they offer a systematic approach to interpreting price movements and identifying potential trading opportunities. By analysing historical data, traders can gain insights into market trends, support and resistance levels, and possible trend reversals. However, it's important to recognize that lagging indicators are not infallible and may generate false signals or lag behind rapid market changes.
In conclusion, lagging indicators play a significant role in technical analysis by providing retrospective insights into market trends and confirming price movements. Traders and investors use these indicators to identify entry and exit points, assess the strength of trends, and validate market behaviour. While lagging indicators are valuable tools, they should be used with other technical analysis tools and considerations to make well-informed trading decisions.
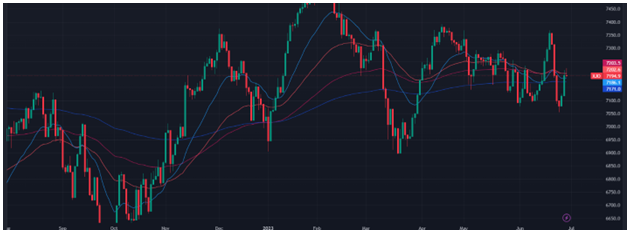
Moving Average
There are many moving averages, such as the Simple Moving Average (SMA) and the Exponential Moving Average (EMA). However, there are a few more types of moving averages, and we'll discuss them all here-
- Simple Moving Average (SMA): The Simple Moving Average is the most basic type of moving average. It calculates the average price of a security over a specific period by summing up the closing prices of that period and dividing the sum by the number of periods. The SMA assigns equal weight to each period in the calculation. For example, a 10-day SMA is calculated by adding the closing prices of the last 10 days and dividing the sum by 10.
- Exponential Moving Average (EMA): The Exponential Moving Average is a more advanced type of moving average that places greater weight on recent prices. Unlike the SMA, which assigns equal weight to all periods, the EMA gives more significance to the most recent prices. This makes the EMA more responsive to current price movements. The calculation of the EMA involves using a smoothing factor that gives more weight to recent data points. The formula for calculating the EMA consists in taking the current price, multiplying it by the smoothing factor, adding it to the previous EMA multiplied by (1 - smoothing factor), and repeating this process for each period.
Both the SMA and EMA have their advantages and uses in technical analysis. The choice between them depends on the trader's preferences and trading strategy. The SMA is often preferred for long-term trend analysis, while the EMA is commonly used for shorter-term analysis and generating trading signals. Traders often experiment with different combinations of moving averages to find the ones that best suit their trading style.
Here are a few other moving averages:
- Weighted Moving Average (WMA): The Weighted Moving Average is another moving average. Unlike the SMA and EMA, which assign equal weight to each period, the WMA assigns different weights to different periods. The weights are usually assigned based on a predefined weighting scheme, giving more importance to recent prices. The calculation involves multiplying each price by its assigned weight, summing up the weighted prices, and dividing the sum by the sum of the weights.
- Triangular Moving Average (TMA): The Triangular Moving Average is a variation of the SMA that smoothes out price fluctuations over a specific period. It is calculated by taking the average of a series of SMAs. For example, a 20-day TMA would involve calculating the SMA for the first 20 days, then the SMA for the next 20 days, and so on. The resulting values are then averaged to create the TMA. This moving average reduces noise and provides a more smoothed representation of the price data.
- Hull Moving Average (HMA): The Hull Moving Average is a weighted moving average that aims to reduce lag while maintaining smoothness. It applies a weighted calculation to the square root of the price data, resulting in a faster and more responsive moving average compared to traditional SMAs or EMAs. The HMA is designed to follow price movements and generate timely signals closely.
- Adaptive Moving Average (AMA): The Adaptive Moving Average is a moving average that adjusts its sensitivity to price volatility. It uses a smoothing factor that dynamically changes based on market conditions. In periods of high volatility, the AMA becomes more responsive to price changes, while in low volatility periods, it becomes less sensitive. This adaptability allows the AMA to provide more accurate signals across market conditions.
These are some of the commonly used types of moving averages. Traders and analysts select the appropriate moving average based on their needs and trading strategies. Each moving average type has its characteristics, advantages, and drawbacks, so it's essential to experiment and find the one that best aligns with your trading goals and preferences.
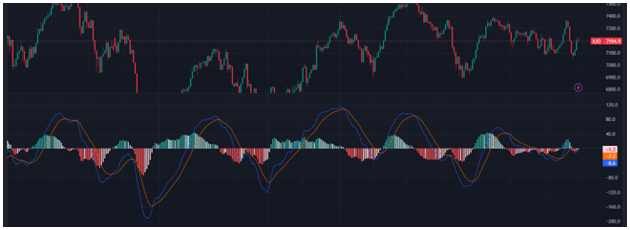
MACD
MACD stands for Moving Average Convergence Divergence, and it is a popular technical analysis indicator used by traders and investors in financial markets, such as stocks, commodities, and forex. MACD is primarily used to identify potential trend reversals, generate buy or sell signals, and gauge the strength of a trend.
The MACD indicator consists of three main components:
- MACD Line: This line is the difference between two exponential moving averages (EMAs), usually a 12-day EMA and a 26-day EMA. The MACD line represents the short-term momentum of an asset.
- Signal Line: The signal line is a 9-day EMA of the MACD line. It helps smooth out the MACD line and generates trading signals. When the MACD line crosses above the signal line, it is considered bullish, indicating a potential buying opportunity. Conversely, when the MACD line crosses below the signal line, it is a bearish signal, suggesting a possible selling opportunity.
- Histogram: The histogram shows the difference between the MACD and signal lines. It provides a visual representation of the convergence and divergence of the two lines. When the histogram bars are above the zero line, it indicates bullish momentum, while bars below the zero line indicate bearish momentum.
Traders and investors use MACD in various ways, including:
- Identifying trend reversals: When the MACD line crosses above or below the signal line, it can indicate a change in the prevailing trend.
- Generating buy and sell signals: Traders look for instances where the MACD line crosses above or below the signal line to initiate buying or selling positions, respectively.
- Divergence analysis: Divergence occurs when the price of a stock moves in a different direction from the MACD indicator. Bullish divergence happens when the price makes lower lows while the MACD makes higher lows, indicating a potential upward reversal. A bearish divergence occurs when the price forms higher highs while the MACD makes lower highs, suggesting a possible downward reversal.
It's important to note that while MACD is a widely used indicator, it should not be relied upon as the sole basis for making trading decisions. It is advisable to use MACD with other technical indicators and analysis tools to confirm signals and increase the probability of accurate predictions.
Oscillators – RSI, Stochastic
RSI:-
RSI stands for Relative Strength Index, a popular technical analysis indicator used by traders and investors to assess the strength and momentum of a price trend in financial markets. RSI is primarily used to identify an asset's overbought and oversold conditions and generate potential buy or sell signals.
The RSI indicator is calculated using the following formula:
RSI = 100 - [100 / (1 + (Average Gain / Average Loss))]
The RSI is typically displayed as an oscillator that fluctuates between 0 and 100. The RSI reading is based on the average of the price gains and losses over a specified period, which is typically 14 periods. However, the number of periods can be adjusted based on the trader's preference and the time frame being analysed.
The RSI indicator provides the following insights:
- Overbought and Oversold Levels: The RSI value is considered overbought when it reaches or exceeds 70, suggesting that the asset may be due for a price correction or a reversal to the downside. Conversely, an RSI value of 30 or below is considered oversold, indicating that the asset may be undervalued and due for a potential price rebound or reversal to the upside.
- Divergence Analysis: Divergence occurs when the price of a stock moves in a different direction from the RSI indicator. Bullish divergence happens when the price makes lower lows while the RSI makes higher lows, indicating a potential upward reversal. A bearish divergence occurs when the price forms higher highs while the RSI makes lower highs, suggesting a possible downward reversal.
- Trend Confirmation: Traders often use the RSI to confirm the strength of a trend. In an uptrend, the RSI tends to stay above 50, while in a downtrend, it typically stays below 50. Traders may look for bullish signals when the RSI crosses above 50 in a downtrend and bearish signals when it crosses below 50 in an uptrend.
It is important to note that the RSI indicator is not infallible and should be used with other technical indicators and analysis tools. It is also advisable to consider the overall market conditions, fundamental factors, and additional relevant information before making trading decisions solely based on RSI signals.
Additionally, different assets and timeframes may require different parameter settings for the RSI indicator to be effective. Traders may need to experiment and adjust the number of periods to suit their trading strategies and the characteristics of the asset being analysed.
Stochastic:-
Stochastic RSI, or StochRSI, is a technical analysis indicator combining two popular indicators: Stochastic Oscillator and Relative Strength Index (RSI). It is designed to provide a more refined and sensitive measurement of overbought and oversold conditions in the market.
The Relative Strength Index (RSI) is a momentum oscillator that assesses whether a market is overbought or oversold by comparing the size of recent gains with recent losses. On the other hand, the Stochastic Oscillator measures the current price range over a specified period.
Combining these two indicators, the Stochastic RSI aims to generate more accurate and timely signals for traders. The Stochastic RSI calculates the RSI value instead of the price and then applies the Stochastic Oscillator formula to the RSI values.
Here are the key components and interpretations of the Stochastic RSI:
- Calculation: The Stochastic RSI is calculated using the following formula:
StochRSI = (RSI - RSI Low) / (RSI High - RSI Low) - RSI Low: Lowest RSI value over a specified period RSI High: Highest RSI value over a specified period
- Range: The Stochastic RSI ranges between 0 and 1. Values close to 0 indicate oversold conditions, while values close to 1 indicate overbought conditions.
- Overbought and Oversold Levels: Traders often use specific thresholds to determine overbought and oversold conditions. The commonly used thresholds are 0.8 for overbought and 0.2 for oversold. When the Stochastic RSI crosses above 0.8, it suggests an overbought market, and when it crosses below 0.2, it suggests an oversold market.
- Divergence: Traders also look for divergences between price action and Stochastic RSI. For example, if the price is making higher highs, but the Stochastic RSI is making lower highs, it could indicate a potential reversal or weakening of the uptrend.
- Signal Generation: Traders typically use the Stochastic RSI with other technical analysis tools to generate buy or sell signals. Some common strategies include crossovers of the Stochastic RSI with its overbought or oversold levels and identifying bullish or bearish divergences.
As with any technical indicator, using the Stochastic RSI in combination with other analysis techniques and risk management strategies is important. It is recommended to practice using the indicator on historical data and in a demo trading environment before applying it to real-time trading decisions.