What will you learn through this module?
- Early Warning Signals.
- Oscillators.
- Confirmation and Divergence
- Volatility Indicators.
- False Signals.
- Timeframes and Market Conditions
- Historical Back testing
- Risk Management
Introduction
Leading indicators play a crucial role in technical analysis, method traders and investors use to forecast future price movements in financial markets. These indicators are based on mathematical calculations and historical price and volume data patterns. They aim to provide early signals of potential market reversals or trends before they occur.
Unlike lagging indicators, which follow price movements and confirm trends, leading indicators attempt to predict future price movements and identify possible entry and exit points. Traders use these indicators to gain an edge in the market, anticipate price direction, and make timely trading decisions.
Leading indicators in technical analysis can be categorized into different types, including oscillators, momentum indicators, and volatility indicators. Here are some commonly used leading indicators:
- Oscillators: Oscillators are indicators that fluctuate between fixed upper and lower bounds. They are primarily used to identify overbought and oversold conditions in the market, which can indicate potential reversals in price. Examples of oscillators include the Relative Strength Index (RSI), Stochastic Oscillator, and Moving Average Convergence Divergence (MACD).
- Momentum Indicators: Momentum indicators evaluate the rate of change in price movements over a specific period. They help identify the strength and speed of price movements and can provide insights into potential trend reversals. Popular momentum indicators include the Moving Average (MA), Average Directional Index (ADX), and Rate of Change (ROC).
- Volatility Indicators: Volatility indicators measure the magnitude of price fluctuations in the market. They can help identify high or low volatility periods, indicating impending price movements. Examples of volatility indicators include Bollinger Bands, Average True Range (ATR), and Standard Deviation.
It's important to note that while leading indicators can be valuable tools in technical analysis, they are not infallible and should be used in conjunction with other analysis methods. False signals and market noise can occur, leading to potential losses if relied upon solely. Traders often combine leading indicators with other technical tools, such as trend lines, chart patterns, and support and resistance levels, to increase the probability of accurate predictions.
Furthermore, it's essential to consider the timeframe and market conditions when using leading indicators. Different indicators may work better in specific market environments, and adjustments may be necessary based on the trader's trading strategy, asset class, and risk tolerance.
Overall, leading indicators in technical analysis serve as valuable tools for traders to anticipate potential price movements and make informed trading decisions. However, traders should always exercise caution, use proper risk management techniques, and continuously evaluate the effectiveness of their chosen indicators within their trading strategies.
Divergence
Divergence is a commonly used concept in technical analysis that helps traders identify potential trend reversals or shifts in momentum. It occurs when the price of an asset and a specific technical indicator move in opposite directions, indicating a discrepancy between the two. Divergence can provide valuable insights into market dynamics and potential trading opportunities. In this explanation, we'll explore the concept of divergence in technical analysis.
1. Understanding Divergence: Divergence refers to a situation where the price of an asset and a related technical indicator fails to confirm each other's movements. It suggests a weakening trend or potential reversal in the price direction. Divergence can occur in different forms, including bullish (positive) and bearish (negative) divergence.
2. Bullish Divergence: Bullish divergence occurs when the price of an asset forms a series of lower lows while the corresponding indicator forms a series of higher lows. The selling pressure is diminishing, and a potential bullish reversal may be on the horizon. Bullish divergence implies that the momentum is shifting despite the downward price movement, indicating a possible buying opportunity.
3. Bearish Divergence: Bearish divergence, on the other hand, happens when the price of an asset forms a series of higher highs while the indicator forms a series of lower highs. This indicates that the buying pressure is weakening, and a potential bearish reversal may occur. Bearish divergence implies that the momentum is slowing down despite the upward price movement, signalling a possible selling opportunity.
4. Types of Divergence: Divergence can be categorized into two primary types: regular and hidden.
- Regular Divergence: Regular divergence is the most commonly recognized form of divergence. It occurs when the price and the indicator move in opposite directions, forming contrasting patterns. Regular divergence is a strong signal widely used by traders to anticipate trend reversals.
- Hidden Divergence: Hidden divergence occurs within an ongoing trend and indicates a potential continuation. It appears when the price forms higher highs or lower lows, while the indicator forms lower highs or higher lows. Hidden divergence suggests that the underlying trend is likely to persist, despite temporary countertrend price movements.
1. Using divergence as a Trading Signal: Traders use divergence to confirm or challenge existing trends and anticipate potential reversals. When divergence occurs, it is often seen as a signal to enter or exit trades.
- Bullish Divergence Trading: Traders may consider entering long positions or tightening stop-loss orders when identifying bullish divergence. This suggests a potential shift from a bearish trend to a bullish one.
- Bearish Divergence Trading: Conversely, when bearish divergence is identified, traders may consider entering short positions or adjusting stop-loss orders. This suggests a potential shift from a bullish trend to a bearish one.
2. Confirming Divergence with Other Indicators: While divergence can be a powerful signal, it is important to use it with other technical analysis tools for confirmation. Traders often combine divergence analysis with trend lines, support and resistance levels, volume analysis, and other indicators to validate their trading decisions.
3. Limitations and False Signals: The divergence has limitations like any other technical analysis tool. False signals can occur, and it is crucial to exercise caution and not rely solely on divergence for trading decisions. Traders should consider the broader market context and fundamental factors and employ risk management techniques to mitigate potential losses.
Multiple Timeframe Divergence Analysis: Analysing divergence across multiple timeframes can enhance the accuracy of trading signals. Divergence observed on higher timeframes is generally considered more significant than on lower timeframes. Traders often use this technique to gain a broader perspective of the market and validate the divergence signal's strength.
- Divergence with Different Technical Indicators: Divergence can be observed with various technical indicators, including oscillators like the Relative Strength Index, Moving Average Convergence Divergence, Stochastic Oscillator, and others. Each indicator may provide different insights into price momentum and divergence patterns. Traders often experiment with various indicators to find the ones that work best for their trading style and the specific asset they are analysing.
- Timeframe and Market Conditions: The effectiveness of divergence analysis can vary depending on the timeframe and market conditions. Divergence may work well in trending markets where significant price swings occur. However, divergence signals may need to be more reliable in sideways or choppy markets. Traders should consider the prevailing market conditions and adjust their strategies accordingly.
- Back testing and Practice: To gain confidence in using divergence as a trading signal, it is essential to conduct thorough back testing using historical price data. Traders can apply their chosen divergence techniques to past market data and analyse the generated signals' performance. This helps understand the strengths and weaknesses of divergence analysis and refining trading strategies.
- Continuous Learning and Adaptation: Technical analysis, including divergence analysis, is a skill that requires continuous learning and adaptation. Markets evolve, and new patterns and dynamics emerge. Traders should stay updated with market trends, explore new tools and techniques, and adapt their strategies accordingly. Learning from experienced traders, attending webinars, reading books, and actively participating in trading communities can enhance divergence analysis skills.
In conclusion, divergence is a valuable concept in technical analysis that helps traders identify potential trend reversals or shifts in momentum. By comparing price movements with related technical indicators, traders can gain insights into market dynamics and make informed trading decisions. However, it is important to remember that divergence is not a foolproof signal and should be used with other analysis techniques and risk management practices. Continuous learning, practice, and adaptation are key to mastering divergence analysis and effectively utilizing it in trading strategies.
Bollinger Band
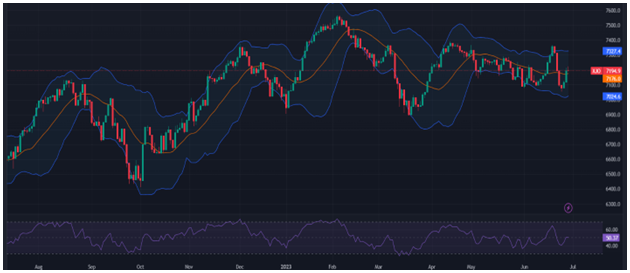
Bollinger Bands are a technical analysis tool traders and investors use to analyse price volatility and identify potential trading opportunities. Developed by John Bollinger in the 1980s, Bollinger Bands consist of three lines plotted on a price chart.
The central line is a simple moving average (SMA) of the asset's price over a specific period. The standard setting for this period is 20 days, but it can be adjusted based on the trader's preference and the time frame being analysed. The middle line represents the average price over the chosen period and is a reference point for the other two lines.
The upper band is calculated by adding a specified number of standard deviations to the middle line. The standard deviation measures the dispersion or volatility of the price around the average. The most common setting for the number of standard deviations is 2, but this can also be adjusted to suit the trader's needs. The upper band represents the upper limit of price movement and is considered a resistance level.
Conversely, the lower band is calculated by subtracting the same number of standard deviations from the middle line. It represents the lower limit of price movement and is considered a support level. The distance between the upper and lower bands is a measure of volatility, with wider bands indicating higher volatility and narrower bands showing lower volatility.
Bollinger Bands are dynamic and adjust to market conditions. As price volatility increases, the bands expand; as volatility decreases, the bands contract. This adaptive nature of Bollinger Bands makes them useful in various market environments.
Traders use Bollinger Bands in several ways. One common strategy is identifying periods of low volatility, known as Bollinger Squeeze, which often precedes significant price moves. A breakout or strong directional movement may be imminent when the bands contract. Traders look for signals such as a price close above or below the bands to enter positions anticipating a breakout.
Another strategy involves using Bollinger Bands in conjunction with other technical indicators. For example, traders may look for a confluence of signals, such as a price approaching the lower band, while the relative strength index (RSI) indicates oversold conditions. This combination could signal a potential buying opportunity.
Bollinger Bands can also be used to measure the strength of a trend. When the price consistently hugs the upper band, it suggests a strong uptrend, while consistent touches of the lower band indicate a strong downtrend. Traders may look for price reversals or trend continuation patterns near the bands to make trading decisions.
It is important to note that Bollinger Bands are not foolproof and should be used in conjunction with other forms of analysis and risk management techniques. Like any technical tool, they are limited and can provide false signals, especially during choppy or ranging markets.
Bollinger Bands is a versatile technical analysis tool that helps traders assess price volatility, identify potential breakouts, and determine trend strength. By providing visual boundaries around price movements, they assist traders in making informed decisions and managing risk. However, combining Bollinger Bands with other indicators and analysis methods is essential to enhance their effectiveness.