What will you learn through this module?
- A brief summary of technical analysis
- A brief summary of the tools we use in the technical analysis.
- Some facts and myths about technical analysis.
- Time frame used in technical analysis.
- Where to enter and exit in a trade.
Introduction
Technical analysis is a method of evaluating a company by analysing statistics generated by market activity. This analysis involves looking at price and volume data and using various technical indicators to identify market trends, patterns, and potential price movements. Technical analysts believe that the historical behaviour of security can provide insights into its future performance.
The basic assumption of technical analysis is that the market price of a stock reflects all available information, including fundamental factors such as financial statements, economic indicators, and news events. Technical analysts trust that price movements are not random but follow trends that can be identified and predicted. They use various charts, graphs, and technical indicators to identify these trends and make investment decisions based on them.
One of the most popular technical indicators is the moving average, which smooths out price fluctuations and identifies trends. A moving average is calculated by averaging the price of a security over a certain period of time, such as 50 or 200 days. Technical analysts use the crossover of different moving averages as a signal for potential price movements.
Another popular technical indicator is the Relative Strength Index (RSI), which measures the magnitude of recent price changes to determine whether a security is overbought or oversold. If the RSI is above 70, the security is considered overbought; if it is below 30, it is considered oversold.
Other technical indicators include the Moving Average Convergence Divergence (MACD), Bollinger Bands, and Fibonacci retracements. These indicators can help technical analysts identify potential support and resistance levels, trend reversals, and other important price movements.
Technical analysis can be applied to any type of security, including stocks, bonds, commodities, and currencies. It is often used by traders and investors to make short-term trading decisions and by long-term investors to identify potential entry and exit points for their investments.
However, critics of technical analysis argue that it is based on past performance and cannot predict future market movements with certainty. They say that fundamental analysis, which looks at the underlying financial and economic factors that affect a security's value, is a more reliable method for making investment decisions.
In conclusion, technical analysis is a popular method for analysing the stock market and other securities. It involves using various charts, graphs, and technical indicators to identify market trends and potential price movements. While it has its critics, many traders and investors rely on technical analysis to make informed investment decisions.
Importance of Technical Analysis
We can consider using technical stock analysis for the following reasons:-
- Identifying trends: Technical analysis can help investors identify trends in the market, such as whether a stock is trending up or down over a specific time frame. By understanding these trends, investors can make more informed decisions about buying and selling the stock.
- Determining Entry and Exit Points: Technical analysis can help investors determine the best time to enter or exit a trade. By looking at historical price movement and volume data, investors can identify critical levels of support and resistance, which can help them determine when to buy or book a profit in a stock. For this, we can take the help of the chart patterns and the candlestick pattern.
- Risk management: Technical analysis can help investors manage risk by keeping a stop loss near a specific support zone. By analysing price data, investors can identify key levels where they may want to exit a trade if the price moves against them. It helps in a big way to protect the capital.
- Market psychology: Technical analysis can provide insights into market psychology and the behaviour of other investors. By understanding how other traders and investors react to market events, investors can better understand market sentiment and make more informed decisions.
One of the key benefits of technical analysis is that it can help investors identify trends in the market. By analysing historical price and volume data, investors can determine whether a stock is trending up or down over a specific time frame. This information can inform investment decisions, as investors may want to buy stocks trending up and avoid those trending down. Additionally, investors may want to take advantage of short-term trading opportunities by buying or selling stocks based on these trends.
Another benefit of technical analysis is that it can help investor’s time trades more effectively. The investor can identify the market's critical support and resistance levels by looking at historical price and volume data. Support levels are prices where investors are more likely to buy a stock, while resistance levels are prices where investors are more likely to sell a stock. By identifying these levels, investors can decide when to enter or book profit in a trade.
In addition to timing trades, technical analysis can also help investors manage risk. By keeping stop-loss orders and other risk management strategies, investors can limit their losses if the price of a stock moves against them. By analysing price data, investors can identify key levels where they may want to exit a trade if the price moves against them. It can help investors limit their losses and preserve capital.
Technical analysis can also provide insights into market psychology and the behaviour of other investors. By understanding how other traders and investors react to market events, investors can better understand market sentiment and make more informed decisions. For example, if investors respond negatively to a particular news event, this could signal a potential downturn in the market. By being aware of market sentiment, investors can make well-informed decisions about when to buy or book profit in the stocks.
While technical analysis is not a perfect science and cannot guarantee success in the stock market, it can be an important tool for investors who want to make informed decisions. By using technical analysis in conjunction with other forms of analysis, such as fundamental analysis, investors can better understand the market and make more informed investment decisions. Technical analysis can help investors identify trends, time trades effectively, manage risk, and gain insights into market psychology. As such, it is an essential tool for investors who want to succeed in the stock market.
Types of Charts-
There are several types of charts that are commonly used in the stock market to visualize price and volume data over time. Some of the most popular types of charts include:
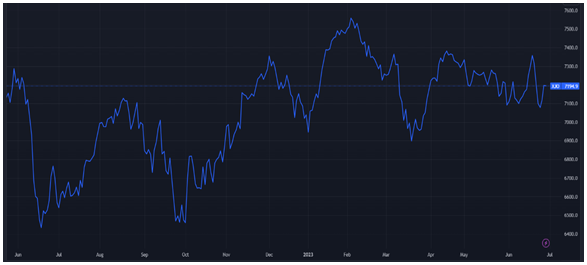
1. Line chart: A line chart is the simplest type of chart used to plot a stock's closing price over a given time frame. It consists of a line that connects the stock's closing prices over time, with time on the x-axis and price on the y-axis.
2. Bar chart: A bar chart is a more detailed version of a line chart that also shows the stock's opening, high, and low prices for each time frame. It consists of a series of bars representing the range between the high and low prices, with a horizontal line inside the bar representing the opening and a horizontal line outside the bar representing the closing price.
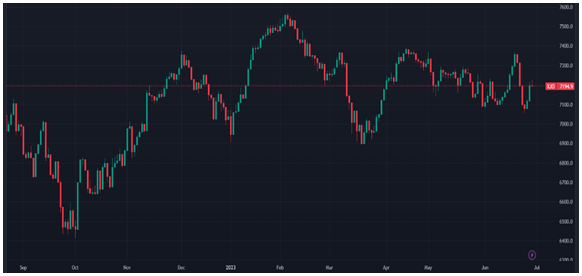
3. Candlestick chart: A candlestick chart is similar to a bar chart but provides more information about the stock price movement. It consists of a series of candlesticks that represent the range between the high and low prices, with a coloured body that represents the difference between the opening and closing prices.
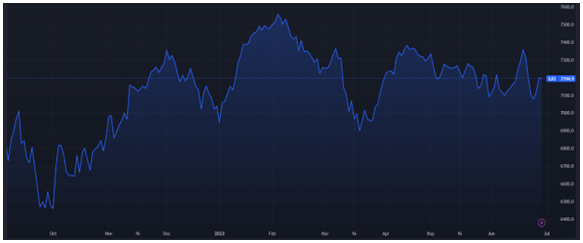
4. Area chart: An area chart is a line chart variation showing the area beneath the line. It helps visualize the total value of a stock over a given time frame and the trend of the price movement
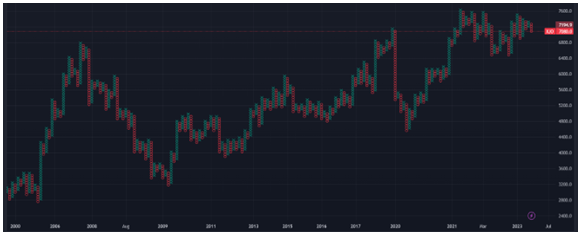
5. Point and Figure chart: A point and figure chart is a unique charting method that uses X's and O's to represent price movements. It helps identify long-term trends in a stock's price movement and can help traders determine entry and exit points.
6. Renko chart: A Renko chart is a type of chart that focuses on price movement rather than time. It consists of a series of bricks representing a fixed price movement, such as a percentage or a set number of points.
In conclusion, different chart types are helpful for various purposes in the stock market. Line charts are great for identifying long-term trends, and bar charts provide more information about short-term trends, and candlestick charts can help traders identify price patterns and potential reversal points. Area charts can help traders visualize the total value of a stock over time, while point and figure charts and Renko charts can help traders identify long-term trends and avoid false signals. By using different chart types combined with other technical analysis tools, traders and investors can better understand a stock's price movement and make more informed trading decisions.
Trading Mindset & Psychology
Trading in the financial markets requires more than just knowledge of technical analysis and fundamental factors. It also requires a strong mindset and psychological discipline. The mental aspect of trading is often overlooked, but it plays a crucial role in defining a trader's success. In this segment, we will explore the critical elements of a trading mindset and the psychology behind it.
- Emotional control: One of the most critical aspects of trading psychology is emotional control. Emotions such as fear and greed can cloud judgment and lead to irrational decision-making. A successful trader must learn to control these emotions and make objective decisions based on their trading plan and strategy. This requires discipline and the ability to detach oneself from the outcome of any individual trade.
- Patience and discipline: Trading is not a get-rich-quick scheme. It requires a lot of patience and discipline to wait for the right opportunities and execute trades according to a well-defined plan. Impulsive and emotional trading can lead to significant losses. Successful traders understand the importance of sticking to their strategy and staying consistent with it based on short-term fluctuations in the market.
- Risk management: A proper trading mindset strongly focuses on risk management. A trader should always be aware of the potential risks associated with each trade and use appropriate position sizing and stop-loss orders to manage those risks. Understanding and accepting that losses are a part of trading is crucial. By managing risk effectively, traders can protect their capital and avoid catastrophic losses.
- Continuous learning: The financial markets are constantly evolving, and successful traders understand the importance of constant learning. They continuously seek to improve their knowledge and skills through reading books, attending seminars, and staying updated with market news. By staying ahead of the curve, traders can adapt to changing market conditions and refine their strategies.
- Confidence and self-belief: Trading requires confidence in one's abilities and a strong belief in the chosen trading strategy. Self-doubt can lead to hesitation and missed opportunities. Traders must have confidence in their analysis and be able to act decisively when the time is right. Developing this confidence takes time and experience but is essential for long-term success.
- Flexibility and adaptability: While having a trading plan is crucial, successful traders also understand the importance of flexibility and adaptability. Market conditions can change rapidly, and traders must be willing to adjust their strategies accordingly. Being open-minded and willing to learn from mistakes is essential for growth as a trader.
- Emotional resilience: Trading can be a challenging and sometimes stressful endeavour. Traders must develop emotional strength to withstand the ups and downs of the market without losing their composure. This involves having a positive mindset, managing stress effectively, and maintaining a healthy work-life balance.
In conclusion, developing a strong trading mindset and psychological discipline is crucial for success in the financial markets. It requires emotional control, patience, discipline, risk management, continuous learning, confidence, flexibility, adaptability, and emotional resilience. Traders with these qualities are more likely to navigate the markets successfully and achieve long-term financial goals. Remember, trading is a journey, and mastering the psychological aspect is just as important as mastering technical skills. By developing a robust mindset, traders can improve their decision-making, manage risk effectively, and increase their chances of long-term profitability.