What will you learn through this module?
- Understanding the relationship between investment risk and return is vital for investors.
- By recognizing the level of risk associated with different investment options and assessing the potential returns, investors can make informed decisions aligned with their financial objectives and risk appetite.
- Achieving long-term investment success ultimately hinges on striking the appropriate equilibrium between risk and return.
Introduction
When investing, one of the fundamental concepts that every investor must understand is the relationship between risk and return. Investing involves inherent uncertainty and the possibility of experiencing both profits and losses. As a result, it is essential to grasp the concept of risk and return to make well-informed investment choices.
Investment risk encompasses the potential for experiencing financial losses due to various factors. These factors can include market volatility, economic fluctuations, and changes in industry trends, political instability, or company-specific risks. Investments with higher levels of risk typically offer greater potential for both increased gains and more significant losses.
Conversely, return pertains to the gains or losses derived from an investment and serves as the compensation investors receive for assuming investment risk. Returns can come in the form of capital appreciation, such as an increase in the value of stocks or real estate, or through income generated from dividends, interest, or rental payments. Investors generally expect compensation for taking on greater risk with the potential for higher returns.
The risk and return relationship can be summarized by the principle of "higher risk, higher return." Investments with the potential for substantial profits are typically associated with increased levels of risk. For example, investing in emerging markets or individual stocks of small companies can offer substantial returns. Still, they also carry higher risks due to their inherent volatility and lack of market stability.
Conversely, investments that are considered safer, such as government bonds or blue-chip stocks, tend to offer lower returns. These investments are associated with lower risk levels, making them more suitable for conservative investors seeking stable and consistent income streams rather than aggressive growth.
Learning Objectives
Investing is a fundamental aspect of building wealth and achieving financial goals. However, it comes with inherent risks and rewards. To make informed investment decisions, individuals must comprehend the concepts of risk and return. By understanding the learning objectives associated with investment risk and return, investors can develop a solid foundation for successful investment strategies.
- Defining Risk and Return: The primary learning objective is to comprehend the definitions of risk and return. Risk refers to the uncertainty and potential for losses in an investment. Conversely, return represents the gains or profits an investor can earn from an investment. Understanding these concepts is crucial for evaluating investment opportunities and managing expectations.
- Assessing Risk Tolerance: Investors' risk tolerance levels differ based on various factors, including financial circumstances, investment goals, and individual preferences. The second learning objective is to determine one's risk tolerance. This involves understanding personal comfort levels with market fluctuations and the impact of potential losses. Assessing risk tolerance helps you choose investment options that align with individual risk profiles.
- Risk-Return Trade-off: Investors need to grasp the concept of the risk-return trade-off. This learning objective highlights the relationship between risk and potential return. Generally, investments with higher potential returns involve higher levels of risk. Balancing risk and return is crucial for constructing a well-diversified portfolio that aligns with an investor's goals and risk appetite.
- Investment Diversification: Diversification is a key learning objective in investment risk and return. Diversification entails distributing investments among various asset classes, sectors, and regions as a risk mitigation strategy. Understanding the benefits of diversification enables investors to reduce the potential impact of underperforming individual investments on their overall portfolio. Diversification can enhance risk-adjusted returns and minimize the potential for significant losses.
- Risk Management Strategies: Investors must learn effective risk management strategies. This includes setting realistic investment goals, establishing an appropriate asset allocation, and conducting thorough research before investing. Identifying and analyzing investment risks helps implement risk management techniques such as stop-loss orders, hedging, and risk mitigation through appropriate investment selection.
- Evaluating Investment Performance: Evaluating investment performance is a crucial learning objective. Investors need to understand how to measure and track their investments' returns, comparing them against relevant benchmarks. This objective involves learning about performance metrics like compound annual growth rate (CAGR), return on investment (ROI), and risk-adjusted measures such as the Sharpe ratio.
Investment and its Objectives
Other than earning a regular income in the form of wages and salaries, one of the most common sources of generating income is investing a part of the steady income in the stock market. Investment refers to acquiring assets to increase their value over time. When a person acquires a good as an investment, the object is not to consume it but to use the good to generate more wealth. In investment, there is some outlay today in the form of time, money, and energy in anticipation of a greater future payoff than the initial outlay.
For example, an investor put $100 today in anticipation of generating $125 by year-end. If the asset's value worth $100 increases, the investor makes a profit. On the flip side, the investor can also make losses if the asset’s value goes down. Hence, in investment, there is always a risk involved. Depending on the level of risk, there is a corresponding return as well.
Investors can invest money in three ways. They can lend money to someone (business or government) on interest. Investors also invest in the form of shares. With this, they become a part-owners of a business. The third is real estate, where investors buy the asset, and its value grows over time.
Objectives of investment:
Investment helps to bridge the gap between one’s dream and reality. Through investment, investors can reach financial goals, beat inflation and earn significant returns. Let us understand each point one by one.
- Reach financial goals: Whatever one’s financial goals, investing your capital optimally can help you achieve financial goals. It could be investing in your child’s education, buying a house, or planning your retirement to meet your financial objectives.
- Beat inflation: Investing money also helps to beat inflation. In case you only save your money, the purchasing power of your money may go down. Thus, many investors invest in financial products that can offer inflation-beating returns to ensure that we achieve inflation-beating returns.
- To earn significant returns: Investors also invest compared to saving their money to earn significant returns. They invest in stocks or mutual funds. These investments help in generating more returns than that fixed deposits or savings accounts.
Different types of investment:
Investment can intimidate a lot of people as there are different options available that fit the portfolio. This section will discuss the ten most common investment types and how they work.
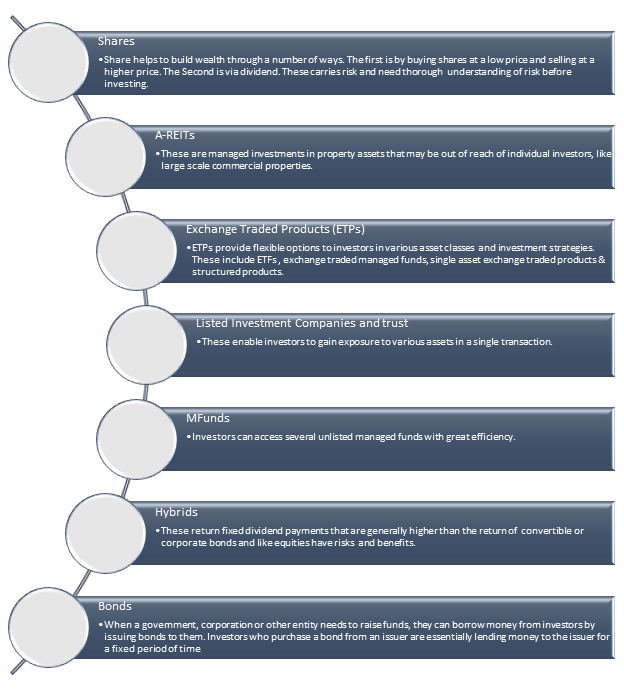
- Stocks: Stocks or equities are amongst the most popular way of investment. When an investor buys a stock, the investor buys the ownership stake in a publicly traded company. In most countries, the stock of big companies is publicly traded. The risk-reward ratio with equity investments is often higher than most other investment forms.
- Bonds: Bonds are also known as fixed-income securities. It is a debt instrument that represents a loan given by an investor to a company or the government. When an investor buys a bond, the investor allows the issuer to issue fixed interest in exchange for using the capital.
- Mutual funds (MFs): A mutual fund is a pool of several investors’ money invested in several companies. A professional Fund Manager manages this pool of money. A trust collects money from several investors who share a common investment objective and invests the same in equities, bonds, money market instruments, and other securities.
- Exchange Traded Funds (ETFs): ETF refers to the basket of securities bought or sold through a brokerage fund on a stock exchange.
- Term Deposits: A term deposit is a savings account that holds a fixed amount of money for a fixed period. The period could be six months, one year, or five years. In exchange, the issuing bank pays interest. When the investor cashes in or redeems the term deposit, they received the money originally invested and the interest.
- Options: Options are contracts giving the purchaser the right but not the obligation to buy or sell a security at a fixed price within a specific period. Stock options are traded on several exchanges. These are highly risky, and one can lose huge money. So, if the stock decreases from its initial price, the investor may lose the money of the contract. Options are an advanced investing technique, and retail investors should exercise caution before using them.
- Annuities: An annuity is a contract between you and an insurance company that requires the insurer to pay immediately or in the future. You buy an annuity by making either a single payment or a series of payments. Annuities can be an additional stream of income for retirement. These are less risky, and they are low growth.
- Derivatives: Derivatives are mostly traded on exchanges and over the counter. Even though a greater portion of the derivatives market consists of OTC derivatives, they pose a greater risk than those traded over exchanges.
- Commodities: Commodities are physical products that you can invest in. They are common in futures markets where producers and commercial buyers seek to hedge their financial stake in the commodities. These are risky and require a thorough understanding of futures before investing.
Some Investment options in Australia:
What is Risk of an Investment and its types
All investment involves some degree of risk. In finance, risk refers to the level of uncertainty or possible financial loss inherent in an investment decision. In general, the higher an investment risk, investors seek higher returns to compensate themselves for taking such risks. Every saving or investment product available in the market involves different levels of risk and return. Different levels of risk and return depend on how readily investors can get their money when needed, how quickly the money will grow, and how safe it is. Below is the list of risks investors face.
Business Risk
Business risk is the risk linked with running a business. The risk can be higher or lower from time to time. But it will be there as long as the business exists or wants to operate and expand. There are several factors that can influence business risk. Some of the business risks include strategic risk, operational risk, reputational risk, compliance risk, legal risk, security risk, financial risk, competition risk, physical risk, etc.
Now, the question comes how to identify this risk. Below are the steps one can take to identify the risk.
- The first step is to analyze the process. One can analyze SWOT (Strengths, Weaknesses, Opportunities, and Threats) to analyze company performance.
- The second step is to conduct a survey of risk at every level of the business.
- The third step is to perform market research to identify the strengths, weaknesses, and risks of the company’s competitors in the industry or area. Then it is important to identify common risks for similar businesses. It will give ideas for policies and processes that reduce these risks.
- In the fourth step, investors can record risk and understand recurring threats to business reputation and profits.
Once risks are identified, investors can follow the below strategies to lessen them.
- Hire a business risk consultant.
- Hire an accountant.
- Develop a risk management strategy.
- Before committing to any loan, investors can perform research.
- Document all relevant financial information.
- Stay informed of all laws and regulations.
- Analyze the risks and rewards of your choices.
Volatility Risk
Volatility is a statistical measure to measure the dispersion of returns for a security or market index. In many cases, the higher the volatility, the higher the risk.
Volatility is measured using standard deviation and variance between returns from the same security or market index. Often volatility is linked with big swings in either direction.
Inflation Risk
Inflation Risk refers to how the prices of goods and services increase more than expected. Contrarywise, such a situation results in the same amount of money, resulting in less purchasing power. Inflation Risk is also known as Purchasing Power Risk.
In inflationary risk, inflation will weaken an investment’s returns through a decline in purchasing power. During the inflation period, the profit and growth of the business is also impacted which in turn impacts investor confidence and impacts the willingness to take risk by holding stocks.
Interest Rate Risk
Interest rate risk is the likelihood of a weakening in the value of an asset resulting from unforeseen fluctuations in interest rates. Interest rate risk is mostly associated with fixed-income assets like bonds rather than equity investments. The interest rate is one of the primary drivers of a bond’s price.
The interest rate is inversely proportional to the security price. As interest rates rise, security prices fall for fixed-income securities because when interest rates increase, the opportunity cost of holding those bonds increases, i.e., the cost of missing out on an even better investment is more.
Liquidity Risk
Liquidity risk is defined as the risk of incurring losses resulting from the inability to meet payment obligations in a timely manner when they become due or from being unable to do so at a sustainable cost.
For financial markets, liquidity signifies how easily an asset can be traded. Brokers often aim to have high liquidity as this allows their clients to buy or sell underlying securities without having to worry about whether that security is available for sale.
Risk Tolerance
Risk tolerance refers to the degree or the level of risk an investor can or is willing to take, considering the volatility of the investment. Risk tolerance determines the type and amount of investments that an individual chooses. Every investment has some or the other risks. By knowing their risk tolerance, investors can plan their portfolios and decide how to invest. Based on the level of risk an investor can tolerate, the investor can be categorized as aggressive, moderate, or conservative. Various factors influence risk tolerance. These are time, financial goal, age, size of the portfolio, and comfort level. Let’s discuss them one by one:
- Time Horizon: Time Horizon is one of the factors that determine risk tolerance. In case an investor has more time, they can take more risk. An investor who starts investing at a young age has more time to invest and can take more risks than investors who start investing at old age.
- Financial Goals: The financial goal of each investor differs from person to person. The sole purpose of the investors is not to earn the most money possible but rather the amount needed to meet specific goals. Investors design investment strategies to deliver such returns based on the financial goal and risk tolerance.
- Age: Young investors are more energetic and can take more risks compared to investors who are old. Young investors have the passion and capability to make more money by working and have more time on their hands to handle all market fluctuations.
- Portfolio size: The risk is inversely proportional to the size of the portfolio. It means that as the portfolio size increases, the risk level decreases. With the increase in the size of the portfolio, the risk gets diversified.
- Comfort level: Every investor has a different risk appetite, and based on that, they handle risk differently. Some investors take more risks compared to others based on their comfort level.
Considering the factors impacting risk tolerance, let’s discuss the level of risk tolerance.
Level of risk tolerance: There are three levels of risk tolerance. These are:
- Aggressive risk tolerance: Aggressive or high-risk tolerance refers to the willingness to lose money to earn high returns. Investors with aggressive risk tolerance deeply understand the market and the securities. These investors accumulate maximum return by taking the maximum risk.
These investors invest in highly volatile securities in the market, like options and other derivative instruments. They focus on capital appreciation instead of concentrating only on generating income and preserving the principal investment.
- Moderate risk tolerance: These investors want to grow money without losing too much. The goal of these investors is to create a balance between the risk and the opportunity. This approach is also known as a balanced strategy.
These moderate-risk investors’ portfolios are a mixture of risky and less risky securities. Risky securities include stocks and derivates; less risky securities include bonds and debenture.
- Conservative risk tolerance: Investors with conservative risk tolerance are unwilling to take or accept volatility in their investment portfolio. These investors are generally those who are about to retire or have already retired and are unwilling to bear any risk of losing their investment. They even have a short-term strategy.
These investors prefer investing in assets that are highly liquid and are guaranteed. Risk-averse individuals commonly opt for bank term deposits, money market instruments, Treasury bills, etc.
Risk Return and Risk Return Indifference Curve
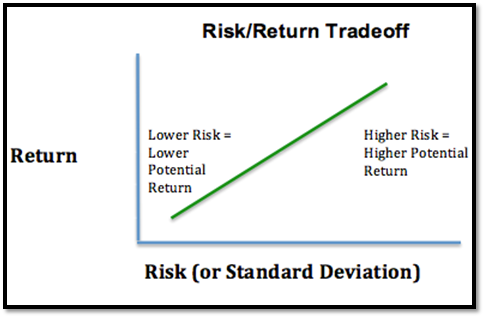
The risk-return trade-off is an investment principle that indicates that the higher the risk, the higher the reward. As per the risk-return trade-off, an investor can make a huge profit if the person can accept a higher probability of losses. The appropriate risk-return trade-off depends on several factors like risk tolerance, age, retirement duration of the investor, etc.
The concept of risk-return in finance refers to the analysis of the likelihood of challenges involved in investing and, at the same time, assessing the return from the same investment.
However, one should also remember that it is not necessary that higher risk will definitely give higher returns and always generate higher revenue. It could be either loss or gain. This concept is quite popular among investors as a technique for choosing any particular investment option. Those investors who invest on a massive scale study the risk and the corresponding return and then accordingly make a decision.
On that note, let’s start the concept with an example.
Example of risk-return trade-off:
Suppose there is an investor, who is deciding whether to invest or not. The investor wants to balance the chance of losses against the possible gain. Let’s say if the investor puts all the money in the savings account, then the gain would be in the form of the interest rate paid by the bank. On the other hand, if the investor invests this money in purchasing stocks of any particular company, then there is a huge possibility of losing the money. At the same time, there are chances of gaining huge as well compared to the return the investor might make while keeping the money in a savings account. This is the trade-off that the investor will have to make in choosing to be open to risk to achieve a bigger gain.
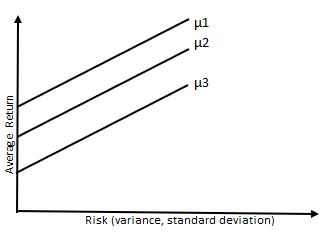
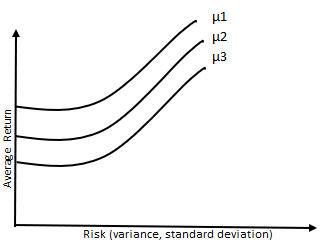
Diagram to represent risk-return trade-off:
Risk-Return Indifference Curve:
Based on their risk appetite, investors have different investment choices. The Risk-Return Indifference Curve plots different combinations of risk and return pairs. For analysis of the choice of a portfolio of assets by individuals or firms, this explains the concept represented by this curve.
Investors generally select a stock that offers maximum return at optimum risk. However, the choice of security, whether risky or non-risky, will depend on the attitude of the investor.
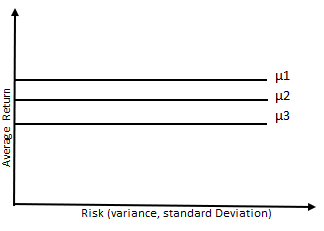
Some investors are risk averse, and they do not want to take risks and follow the safe path. They try to avoid high-risky assets and go for less-risky assets. In this case, the Risk-Return Indifference Curve will be positively sloped. On the other hand, some investors are ready to take huge risks. In this case, the Risk-Return Indifference Curve will be positively sloped and will be convex. In the case of risk-neutral investors, the Risk-Return Indifference Curve will be a horizontal shape. Let’s understand this with an example.
Risk-Neutral Investor:
Risk Averse Investor:
Investor with high risk-taking potential:
In case of an emergency, there is a high chance that the investor holding risky assets may experience huge losses on the principal amount. The value of the risk showcases the level of risk taken by the investor. When investors own a high-value investment, their risk-bearing increases and vice-versa. In that case, if the investor holds risky securities/assets, they may not go for more risky assets. On the flip side, if the investor owns less risky investments, they may opt for high-risk assets.
Risk Return Concept
In the world of finance, the risk-return concept is a fundamental principle that investors use to evaluate investment opportunities. The risk-return concept suggests that there is a relationship between returns and risk in investments. It is important for investors to understand and carefully manage the risk-return tradeoff to make informed decisions and maximize the performance of their investment portfolios.
- Defining Risk and Return: Before delving deeper into the risk-return concept, it is essential to understand the individual components. It can arise from various factors, such as market volatility, economic conditions, industry-specific risks, and company-specific risks. On the contrary, return refers to the potential profit or gain that investors expect to achieve from an investment. It is typically expressed as a percentage and represents the potential financial reward associated with assuming risk.
- The Risk-Return Tradeoff: The risk-return tradeoff implies that there is a correlation between the level of risk and potential returns associated with an investment. Investments with the potential for substantial returns typically involve greater uncertainty and volatility. Conversely, investments offering lower risk tend to yield lower returns. The risk-return concept is based on rational decision-making, where investors carefully consider the potential rewards in relation to the associated risks before making investment decisions.
- Understanding Risk Tolerance: Younger individuals, who have a longer investment horizon ahead of them, often exhibit a greater willingness to assume higher levels of risk in pursuit of higher potential returns. This is due to their advantage of having more time available to recover from any potential losses that may occur. Conversely, older individuals nearing retirement may prioritize capital preservation and opt for lower-risk investments, even if it means sacrificing potential returns.
- Diversification and Risk Management: Diversification involves spreading investments across various asset classes, industries, and geographical regions. This approach is designed to reduce the negative effects of underperforming individual investments. Diversification helps mitigate the risk of substantial losses because different investments may respond differently to changing market conditions.
- Risk Assessment and Analysis: Investors should conduct a thorough evaluation of the specific risks associated with an investment. This assessment encompasses various aspects such as the financial performance of the investment, the quality of management, the competitive landscape, and regulatory factors. Additionally, analyzing historical performance, conducting scenario analysis, and considering external factors can provide a more comprehensive understanding of the potential risks involved.
- Risk Mitigation Strategies: To manage risk effectively, investors can employ various strategies. Investors often utilize a stop-loss order as a prevalent method to minimize risk. This order automatically sells an investment when it reaches a predetermined price, effectively mitigating potential losses. Additionally, employing hedging techniques, such as options or futures contracts, is another strategy employed to counterbalance potential losses within a portfolio. Additionally, staying informed, regularly reviewing investments, and adjusting portfolios based on changing market conditions can help mitigate risk.
Standard Deviation
Standard deviation is one of the most common ways to determine risk, as it helps to determine market volatility. In simple terms, Standard deviation helps to determine the spread of the asset prices from their mean prices. So, if the standard deviation value is very high, the asset tends to be highly risky and vice versa. If the asset has a low standard deviation, we say that the asset has low risk, i.e., the asset’s price will be calm. On that note, let’s start this topic by defining standard deviation.
Definition:
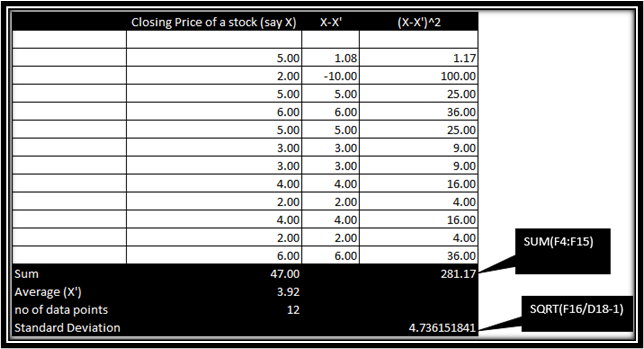
Standard deviation can be defined as a statistical tool to measure the dispersion of a data set relative to its mean. It is calculated as the square root of variance by determining each data point’s deviation compared to its mean.
Calculation:
Standard Deviation = i-1n(x-x)2n-1
xi = Value of ith point in the data set.
x = Mean value of data set
n= number of data points in a data set.
Steps to calculate Standard Deviation:
- Calculate the mean of all the data points. For this, we need to add the total data points and divide them by the number of data points.
- Now, we will calculate the variance. For this, we will subtract each data point from the mean.
- Square the variance for each data point which we calculated in step 2.
- Add all the data retrieved in step 3
- Divide the sum obtained in step 3 by the total data points minus 1.
- Take the square root of the value obtained in step 5.
Application of standard deviation:
In the world of the stock market, standard deviation has a key role to play. It is a useful tool in investing and trading strategies as it helps measure market and security volatility as well as predict performance trends. This tool is used by analysts, portfolio managers, and advisors. A larger dispersion shows how much the return on the fund in deviating from the normal return.
If the stock trades near the narrow trade range, the standard deviation will return a low value. Thus, it indicates low volatility. On the other hand, if the deviation is huge, it means the stock is highly volatile and is risky.
Variance
Investing is a crucial aspect of financial planning, allowing individuals and organizations to grow their wealth over time. However, investing is not without its risks. The variance of investment risk and return plays a fundamental role in determining the potential gains or losses associated with different investment opportunities.
Variance, in the context of investments, refers to the statistical measure that quantifies the dispersion or spread of investment returns around their average or expected value. It provides valuable insights into the potential fluctuations in investment performance and is a key parameter used to gauge risk.
- Understanding Investment Risk: Investment risk encompasses the probability of incurring losses or not achieving the expected returns. It arises from various factors, including market volatility, economic conditions, geopolitical events, and specific risks associated with the particular investment instrument or asset class. By analyzing variance, investors can assess the range of potential outcomes and evaluate the level of risk associated with a particular investment.
- Measuring Variance: To calculate the variance of an investment, historical return data is typically used. The process involves determining the deviation of each return from the average return and squaring the differences. These squared deviations are then averaged to obtain the variance. A higher variance indicates greater volatility and a wider range of potential returns, indicating a higher level of investment risk.
- Risk-Return Tradeoff: Generally, investments with higher expected returns tend to carry greater risk. This is because risk-averse investors require compensation for taking on additional risk. The variance of investment returns allows investors to assess the potential rewards against the associated risks and make informed decisions.
- Diversification and Variance: Diversification is a risk management strategy that aims to minimize the overall investment risk by spreading investments across different asset classes, industries, or geographical regions. By diversifying, investors can potentially reduce the variance of their investment portfolio. This is because different assets or investments may have varying levels of correlation, and when combined, their returns can offset each other, thereby reducing overall portfolio volatility.
- Risk Measurement Tools: Several statistical tools are commonly used to measure and analyze investment risk and variance. A commonly employed tool in assessing investment risk and return is the standard deviation, which is derived by taking the square root of the variance. Standard deviation provides a more easily interpretable measure of risk as it is expressed in the same units as the investment returns.
Another useful tool is the Sharpe ratio, which incorporates both the variance of returns and the risk-free rate of return. It quantifies the excess return earned per unit of risk taken, providing a valuable metric for comparing investment opportunities.
Co-relation
Co-relation is the statistical measure that expresses the extent to which two variables are related to each other. This helps to identify the relationship between the two variables without making any statement related to cause and effect.
Stock co-relation describes the relationship between two stocks and their respective price movements. It can also refer to the relationship between stocks and other asset classes, such as bonds or real estate.
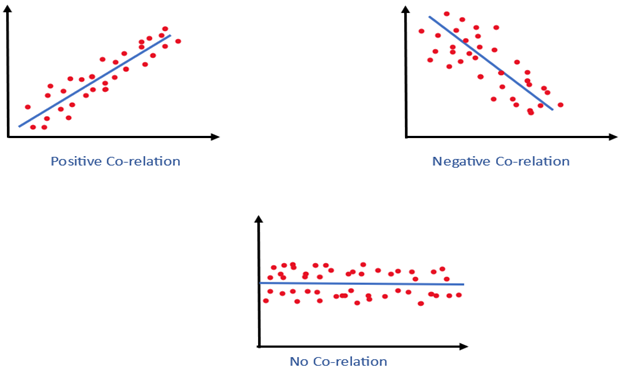
In simple terms, stock co-relation tells us how stocks move in relation to one another. Stock co-relation could be positive as well as negative. A positive co-relation means that two stocks either increase or decrease in the same direction. If the stocks are negatively co-related, it means that one stock is increasing and the other is decreasing. Other than positive or negative co-relation, the third co-relation is no co-relation. In no co-relation, the stocks behave very differently and have no linear relationship.
Diagrammatical representation:
Formula to calculate Co-relation:
The formula for calculating the co-relation coefficient (r) between two sets of data (x and y) is:
r=(nxy-xy)[(nx2 -(x)2) X (ny2 -(y)2)]
Where:
n is the number of pairs of data
Σxy is the sum of the products of corresponding values of x and y
Σx is the sum of the values of x
Σy is the sum of the values of y
Σx2 is the sum of the squares of the values of x
Σy2 is the sum of the squares of the values of y
This formula is known as the Pearson co-relation coefficient, which measures the linear relationship between two variables.
Steps to calculation co-relation between two stocks
To calculate the co-relation between two stocks, you can follow these steps:
- Collect the historical prices of both stocks: Gather the historical prices of both stocks for a period of time. This could be daily, weekly, or monthly prices, depending on your preference.
- Calculate the returns of each stock: Calculate the percentage change in the prices of each stock over the time period. This is done by dividing the current price by the previous price, then subtracting one, and multiplying by 100.
- Calculate the co-relation coefficient: Once you have the returns of each stock, you can calculate the co-relation coefficient, which measures the degree of association between the two stocks. There are different methods to calculate the co-relation coefficient, but one of the most common is the Pearson correlation coefficient.
- Interpret the co-relation coefficient: The co-relation coefficient ranges from -1 to 1, where -1 indicates a perfect negative co-relation, 0 indicates no co-relation, and 1 indicates a perfect positive co-relation. The closer the coefficient is to -1 or 1, the stronger the co-relation between the two stocks.
Keep in mind that co-relation does not necessarily imply causation. A high co-relation between two stocks does not necessarily mean that one stock causes the other to move, as other factors may affect both stocks.
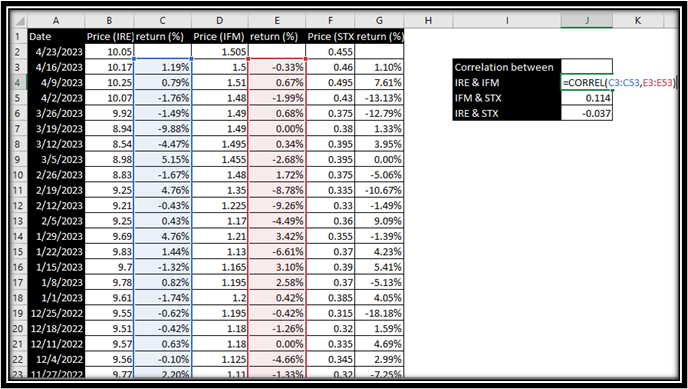
Steps to calculate co-relation between stocks on excel
To calculate the co-relation between two stocks in Excel, you can follow these steps:
- Enter the historical prices of the two stocks in separate columns.
- Calculate the returns of each stock by subtracting the current price from the previous price and dividing the result by the previous price. You can use the formula = (current price-previous price)/previous price and drag it down to apply to the entire column.
- Use the "CORREL" function to calculate the co-relation coefficient. The formula is =CORREL (range1, range2), where "range1" is the range of returns for the first stock, and "range2" is the range of returns for the second stock. For example, if the returns for the two stocks are in columns B and C, you can use the formula =CORREL (B2:B100, C2:C100) to calculate the co-relation coefficient for the first 100 rows.
- Interpret the co-relation coefficient. As mentioned earlier, the co-relation coefficient ranges from -1 to 1, with -1 indicating a perfect negative co-relation, 0 indicating no co-relation, and 1 indicating a perfect positive co-relation.
Note that co-relation does not imply causation, and it's important to consider other factors that may affect the movements of the two stocks. Additionally, co-relation coefficients are sensitive to outliers and may not accurately reflect the true relationship between the two stocks if there are extreme values in the data.