Market Alert: Ukraine Conflict Update and U.S. Policy Risk

ASX 300 (XKO) at Crossroads: Testing Channel Resistance Amid Strong Momentum

Introduction:

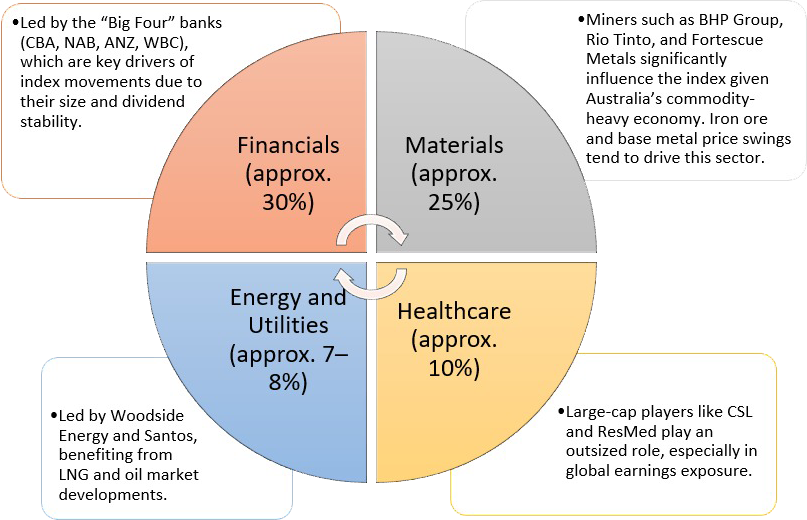
The S&P/ASX 300 Index (XKO) is one of the most comprehensive measures of the Australian equity market, covering the top 300 listed companies by market capitalization. It accounts for over 90% of the ASX’s total value, giving investors exposure to both blue-chip giants and smaller growth companies. The index is structurally weighted toward financials and resources, reflecting Australia’s banking strength and commodity-driven economy, while also including meaningful representation from healthcare, technology, energy, and consumer sectors. As such, it captures both domestic economic conditions and global market trends.

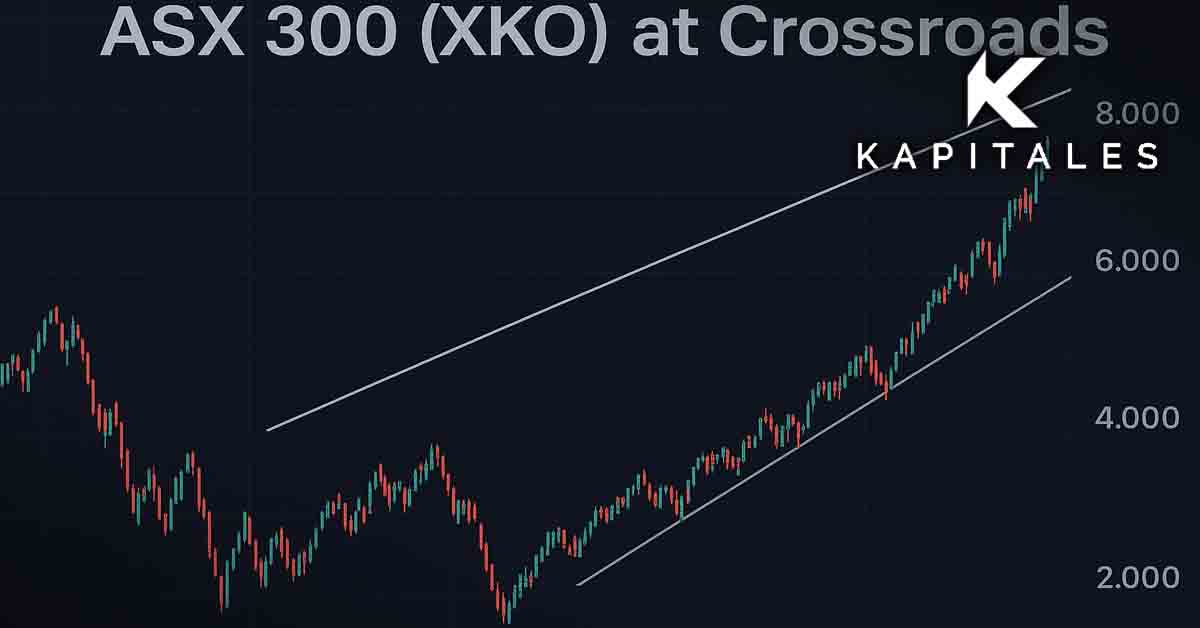
Movements in the ASX 300 are influenced by factors such as Reserve Bank of Australia policy, commodity demand (especially from China), and global monetary and geopolitical developments. Recently, the index has been trading near multi-year highs, supported by strong earnings from major banks, resilient iron ore and energy exports, and defensive contributions from healthcare and technology. While the outlook remains constructive, risks around high interest rates, China’s economic slowdown, and global uncertainty mean the index is likely to experience periods of consolidation alongside its longer-term growth trajectory.

Major Contributors of the Index

The XMD is less dominated by a handful of giants compared to the ASX 200 or 300, making sectoral contributions more balanced.

index-chart

Outlook:

Australia’s equity outlook will hinge on monetary policy, commodity trends, and global growth. A potential dovish shift by the RBA could support financials, REITs, and consumer/property sectors, while structural tailwinds keep technology and healthcare attractive. Resources and energy are expected to stay volatile but remain earnings-supportive due to supply constraints. However, risks include sustained high interest rates capping valuations, a deeper China slowdown dragging on the resource-heavy index, and ongoing geopolitical tensions creating uncertainty.

Technical Analysis

index-chart Source: TradingView, Analysis by Kapitales Research

Trend:The index has been trading in an uptrend. Currently, it is near the upper resistance zone (AU$8,900–AU$9,110).

Pivot Levels:

R1: AU$8,604.80 – Successfully broken and now acting as support.

R2: AU$9,110.70 – Next major resistance, aligning with the top of the channel.

P: AU$7,936.20 – Strong mid-level support zone.

Moving Averages:

Price is comfortably above 20 weeks (AU$8,482.50), 50 weeks (AU$8,239.00), 100 weeks (AU$7,967.50), 200 weeks (AU$7583.70) exponential moving averages, indicating strong bullish momentum.

RSI: Currently at ~69, approaching overbought territory. This suggests momentum is strong, but a short-term pullback or consolidation is possible.

Technical View: The index remains in a bullish uptrend but is nearing overbought. A breakout above AU$9,110 could trigger a new leg higher, while failure may see a pullback toward AU$8,400–AU$8,600 support.

Conclusion:

The ASX 300 is trading near the top end of its bullish trend, reflecting strong momentum supported by financials, materials, and healthcare leaders. While the medium-term outlook remains constructive, driven by Australia’s resource base and stable corporate earnings, the index is technically stretched in the short run.

A break above AU$9,110 would confirm further upside potential, while consolidation around AU$8,400–AU$8,600 should not be ruled out. Longer-term investors may continue to benefit from Australia’s resource leverage and income-rich dividend profile, but should remain mindful of external risks from China and global interest-rate policy.